How to improve quality control in production: an 8-step playbook for QHSE teams (2026)
How to improve quality control in production: control plans, SPC, in-line checks, NCR/CAPA and digital workflows, with templates for quality teams.


Key takeaways
- Start with measurable standards at every control point. Every check needs criteria operators can apply on the spot.
- A documented control plan makes quality a daily routine. It defines each check, its frequency, and its reaction plan.
- In-line checks with real-time capture beat after-the-fact logging. The sooner a defect is recorded, the fewer bad parts get made.
- Non-conformance report (NCR) and corrective and preventive action (CAPA) workflows stop repeat defects. Contain, find the root cause, fix, then verify.
- Digital workflows replace paper lag with traceable records. Mobile inspections feed first pass yield (FPY) and cost of poor quality (COPQ) metrics.
Why quality breaks down and how to improve quality control in production
Most production quality still runs on checks recorded after the fact. Clipboards get filled in at shift end. Scrap and rework climb as defects surface downstream, and the root cause rarely gets pinned down.
If you're working out how to improve quality control in production, start with that lag. The widely cited 1-10-100 rule is a heuristic: 1 unit of cost to prevent a defect, 10 to fix it internally, 100 once it reaches the customer, before you count the damage to your brand reputation. Your ratios will differ, but costs climb the later you catch a defect.
Extra end-of-line inspectors still catch defects late. The fix is building quality into your production processes with executable standards, in-line checks, closed-loop corrective action, and traceable data. This eight-step playbook for QHSE (quality, health, safety, and environment) teams covers production quality control with templates and worked examples. The steps apply to quality control in manufacturing generally, from machined parts to building materials and food production. Regulated sectors layer their own industry regulations on top, such as Hazard Analysis and Critical Control Points (HACCP) in food. If you also run site work, see our guide to quality control on construction sites.
Quick diagnosis: where quality breaks down in production
Find your weakest control point first. Quality escapes cluster at four stages, each with a recognizable symptom.
| Control stage | What goes wrong | Symptom you'll see |
|---|---|---|
| Incoming inspection | Defective raw materials or components enter unchecked | Defects traced to one supplier lot |
| In-process control | Process drift or setup errors create defects mid-run | Scrap rises gradually across a shift |
| Final inspection | Defects found after value is added | Customer returns for catchable issues |
| Changeovers and first-off inspection | A skipped first-off check repeats a setup error | Scrap spikes after changeovers |
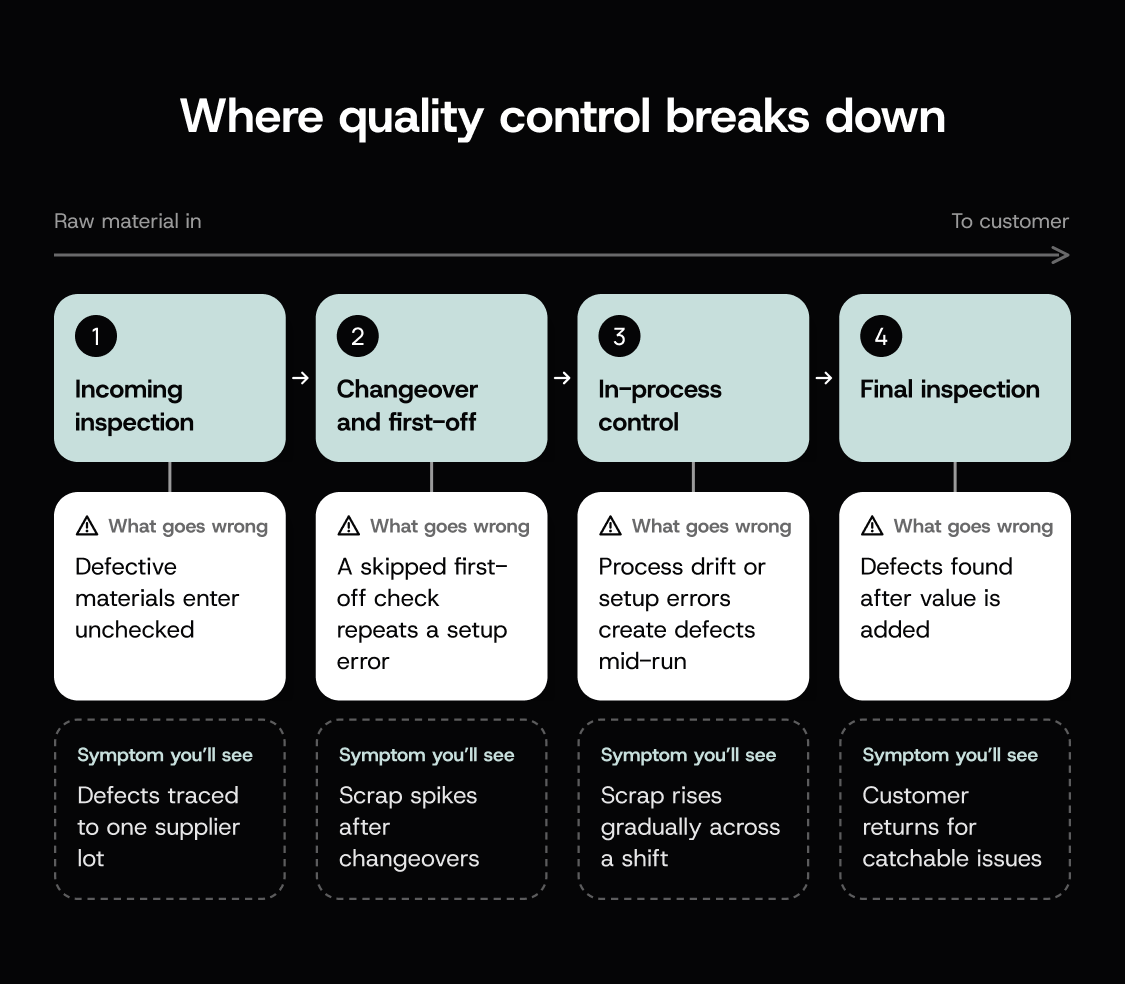
For a quick self-assessment, tag each defect from the last 90 days with the stage where it was created and where it was found. Include customer complaints and returns, so customer feedback counts alongside internal scrap. Which stage accounts for most of your scrap or rework? Start there.
Step 1: Define quality standards operators can execute
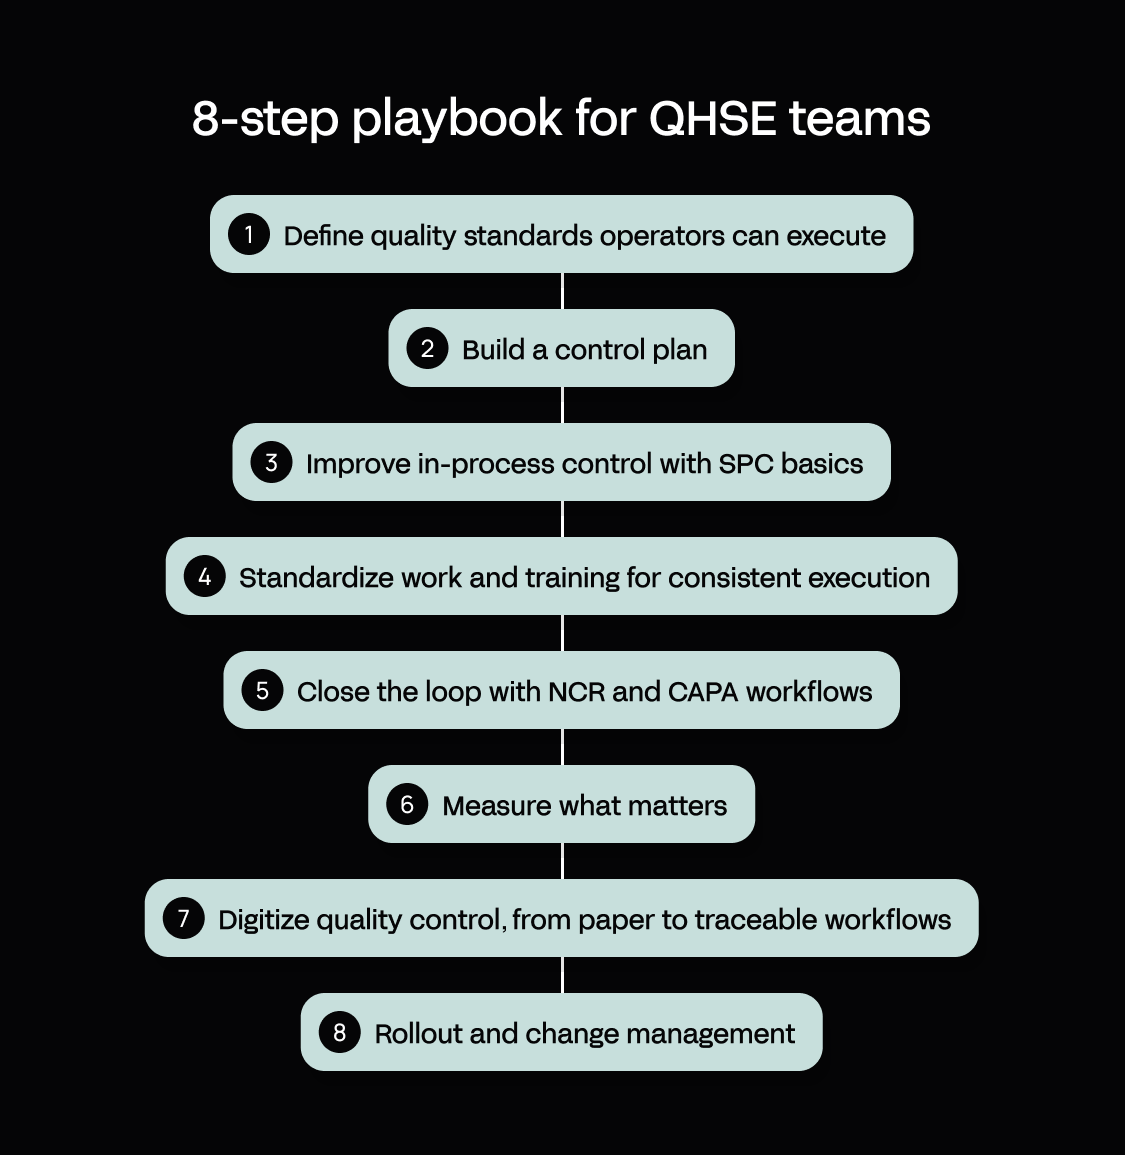
Operators can only control product quality if they can tell good from bad at the station. That starts with critical to quality (CTQ) characteristics: the few attributes that decide whether a part is acceptable. Each CTQ must be measurable, like a dimension, or verifiable, like a go/no-go gauge. Pull them from the drawing, the customer's quality specifications and any industry standards that apply, then add the failure modes your complaint history points to.
For a machined component, CTQs might look like this (Ra is average surface roughness):
| Characteristic | Specification | Measurement method | Acceptance criteria |
|---|---|---|---|
| Bore diameter | 12.00 mm ± 0.02 mm | Bore gauge | 11.98–12.02 mm |
| Surface finish | Ra ≤ 1.6 µm | Roughness tester | Reading at or below 1.6 µm |
| Bore edge burrs | None permitted | Visual and touch check | No visible or tactile burr |
Write standards in plain language and post photos of acceptable and defective parts at the workstation. If an operator needs a binder to check a tolerance, the standard won't get used. These CTQs become your control plan's "what to measure" column.
Step 2: Build a control plan (with downloadable template)
A control plan is the single document that covers the entire production process, from incoming material to final product. It says what to check, when, how, and what to do when a result is out of spec.
High-risk CTQs may need 100% inspection, while stable ones can use sampling or statistical process control (SPC). For lot-by-lot attribute sampling, ISO 2859-1 gives sampling plans indexed by acceptance quality limit (AQL): lot size and inspection level set the sample size, and the AQL sets how many defects a sample can contain.
| Process step | CTQ | Specification | Method | Frequency | Reaction plan |
|---|---|---|---|---|---|
| Incoming bar stock | Material grade | Per purchase order | Supplier certificate check | Every lot | Hold lot, open NCR |
| CNC (computer numerical control) turning | Bore diameter | 12.00 mm ± 0.02 mm | Bore gauge | First piece, then 5 per hour | Stop machine, check tool wear, quarantine since last good check |
| Final inspection | Appearance | No visible defects | Reference photo | AQL sampling per ISO 2859-1 | Quarantine lot, open NCR, notify supervisor |
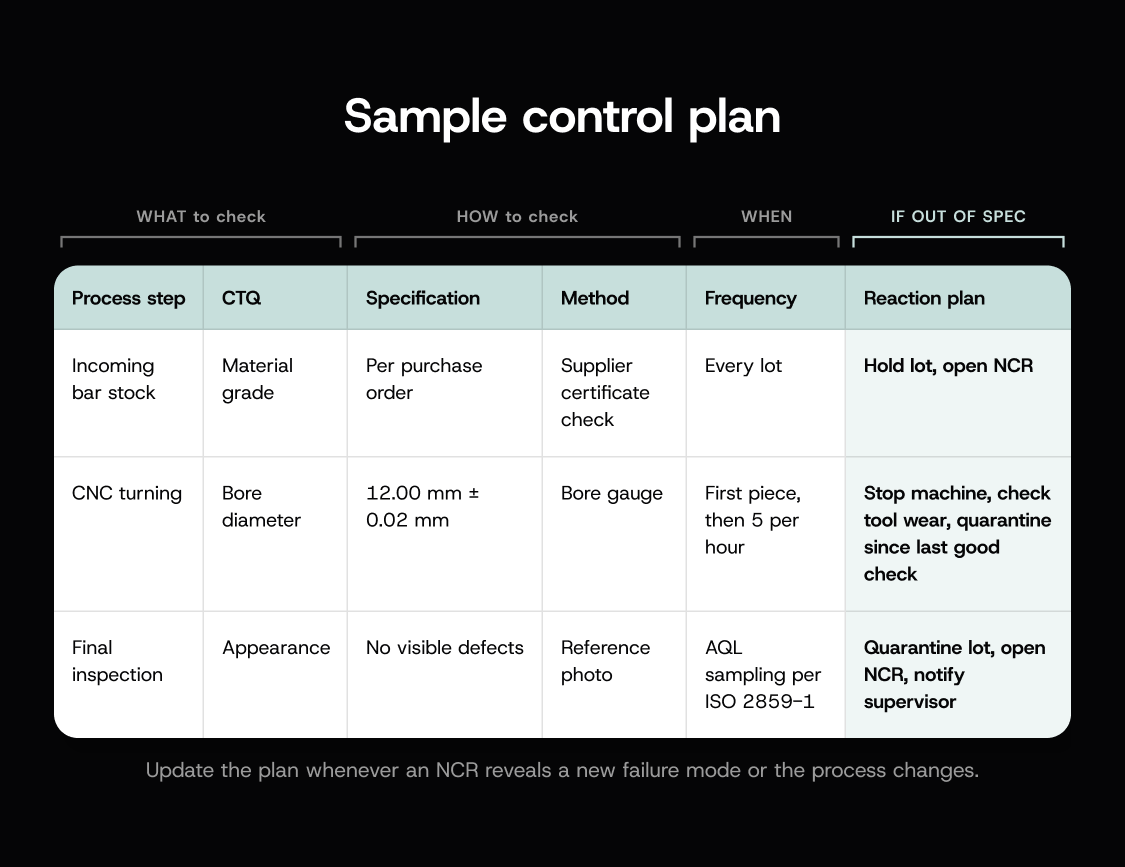
Update the plan whenever an NCR reveals a new failure mode or the process changes.
Download our control plan template to map your quality checks and reaction plans in one place.
Step 3: Improve in-process control with SPC basics
Final inspection tells you a defect happened. SPC warns you the process is drifting before it makes one. You measure small samples at set intervals and plot them on a control chart. SPC is one part of statistical quality control, alongside the acceptance sampling in step 2 and the capability analysis in step 6.
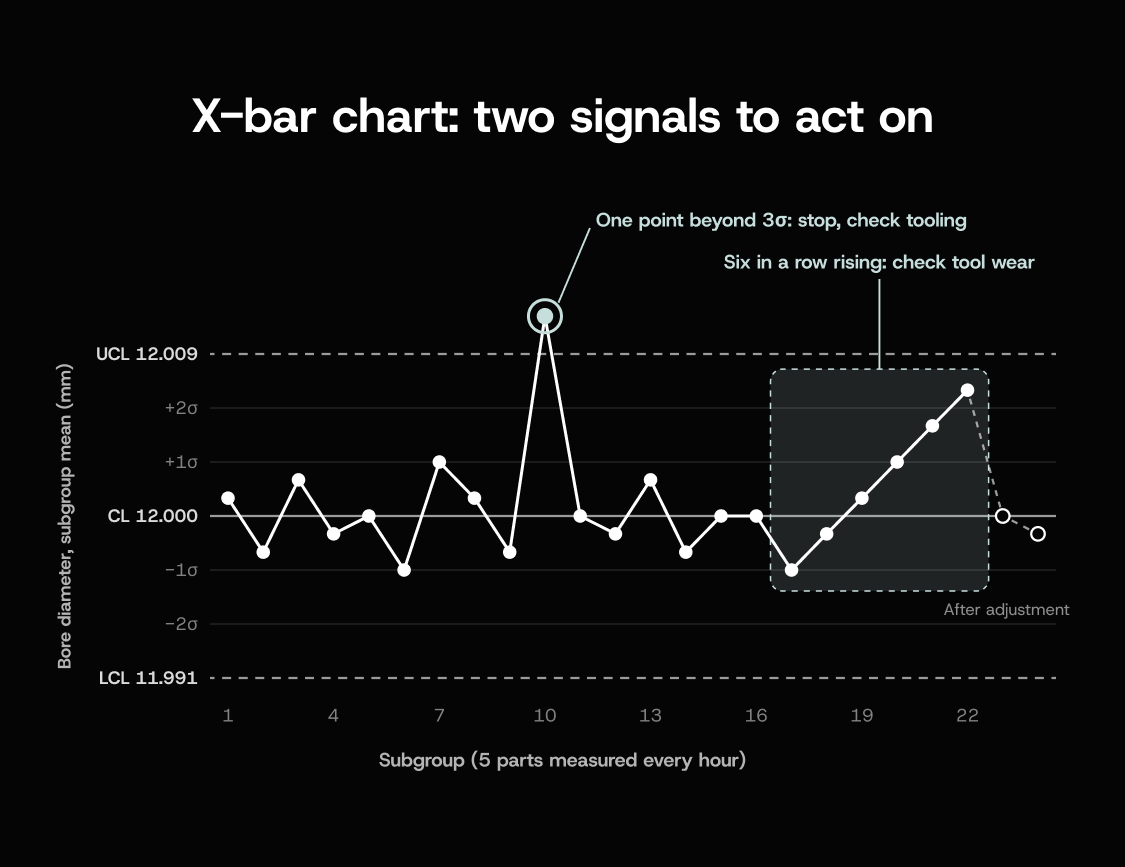
The most common tool is the X-bar and R chart, which tracks each subgroup's average and range. In a worked example, you measure the bore diameter of 5 parts every hour and plot the average (X-bar) and range (R). If a point falls outside a control limit, or 6 consecutive points trend upward, stop and check for tool wear.
The National Institute of Standards and Technology (NIST) Engineering Statistics Handbook lists these signals, where σ is one standard deviation:
- One point beyond 3σ
- Two of three consecutive points beyond 2σ on the same side
- Four of five consecutive points beyond 1σ on the same side
- Eight consecutive points on one side of the centerline
- Six points in a row trending up or down
- Fourteen points in a row alternating up and down
Each extra rule catches drift sooner but raises false alarms. NIST notes the Western Electric rules give a false alarm about every 92 points, versus every 371 for the 3σ rule alone.
Tie every signal to a reaction plan: stop, check tooling and setup, adjust, then verify the next subgroup. SPC fits high-volume, repeatable work; low-volume jobs suit first-article or 100% inspection.
Step 4: Standardize work and training for consistent execution
Consistent quality depends on every shift running the control plan the same way. That means visual standard operating procedures (SOPs) for each inspection, kept at the workstation and version-controlled.
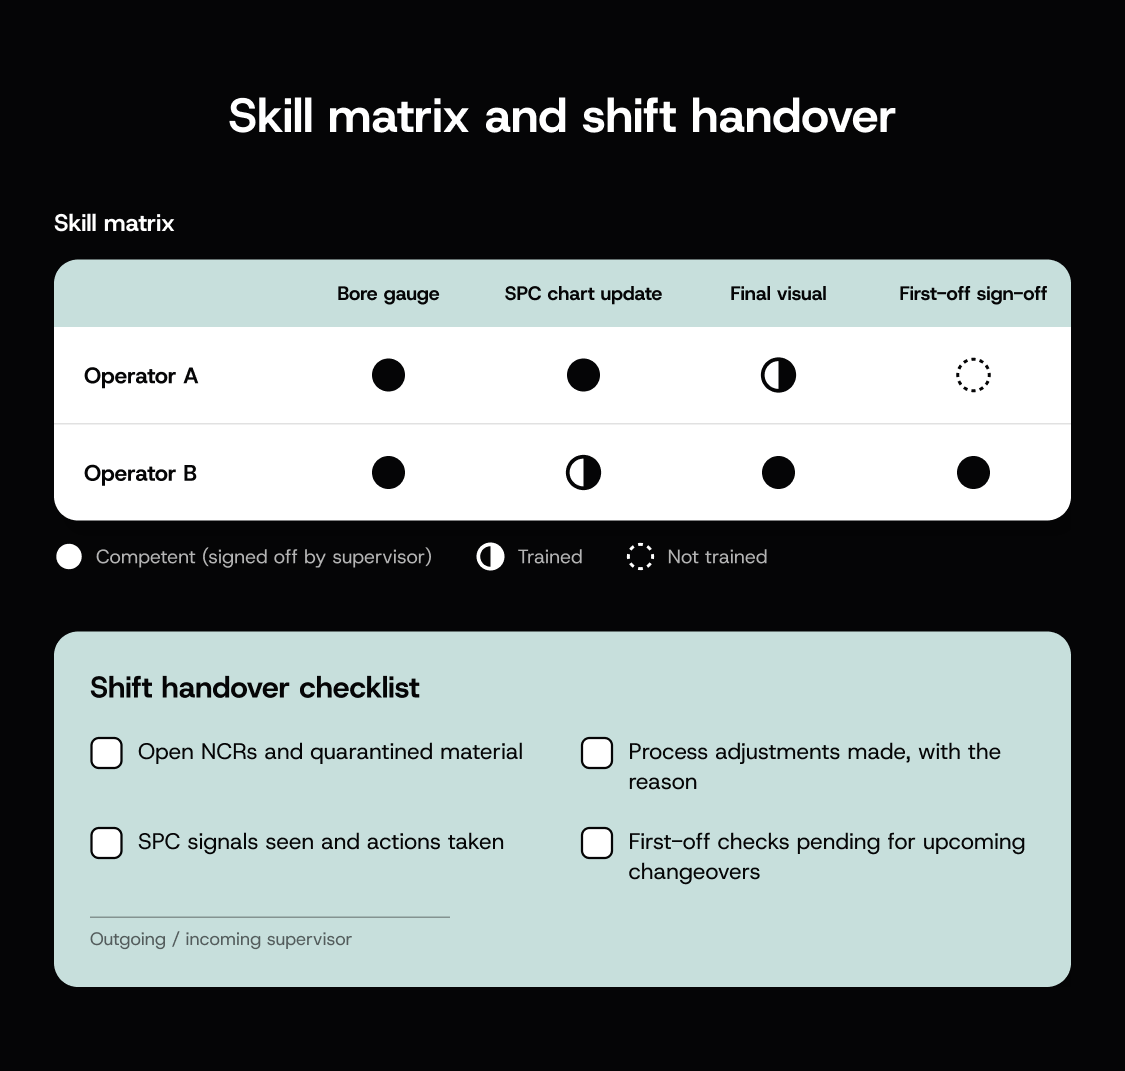
Train operators on the control plan and its reaction procedures, then record sign-off per task. Build this into your employee training programs, so new starters learn the checks before they run a station alone. A skill matrix makes coverage visible for shift planning.
| Operator | Bore gauge | SPC chart update | Final visual | First-off sign-off |
|---|---|---|---|---|
| Operator A | Competent | Competent | Trained | Not trained |
| Operator B | Competent | Trained | Competent | Competent |
"Competent" means a supervisor has observed and signed off the task. Gaps show up before the changeover.
A shift handover checklist should cover:
- Open NCRs and quarantined material
- Process adjustments made, with the reason
- SPC signals seen and actions taken
- First-off checks pending for upcoming changeovers
Step 5: Close the loop with NCR and CAPA workflows
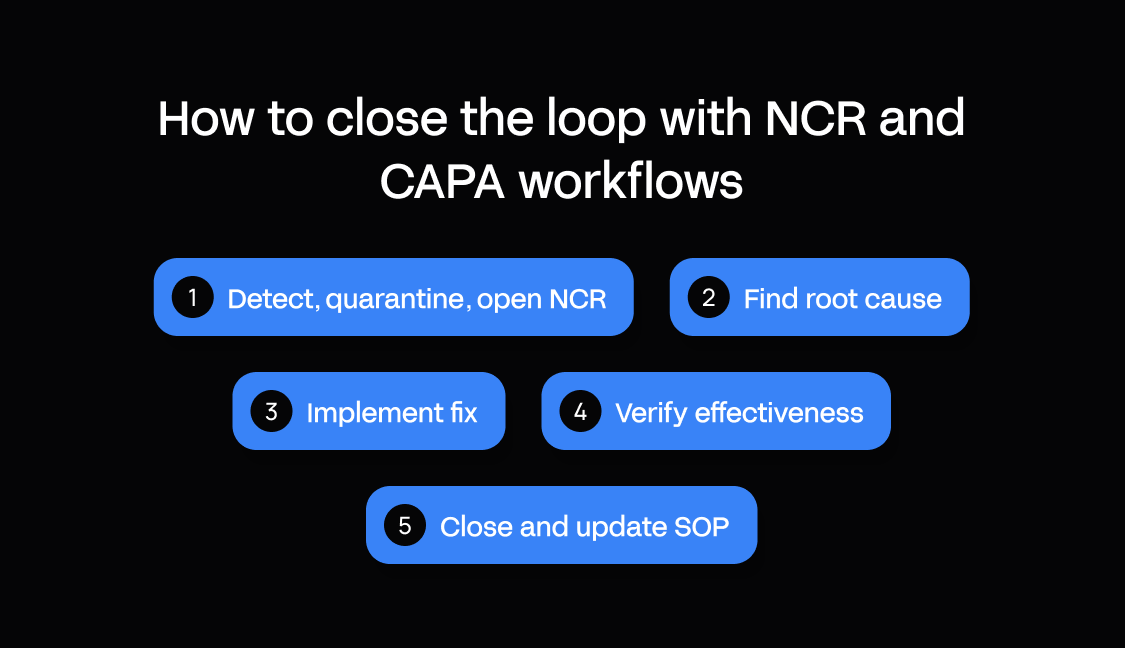
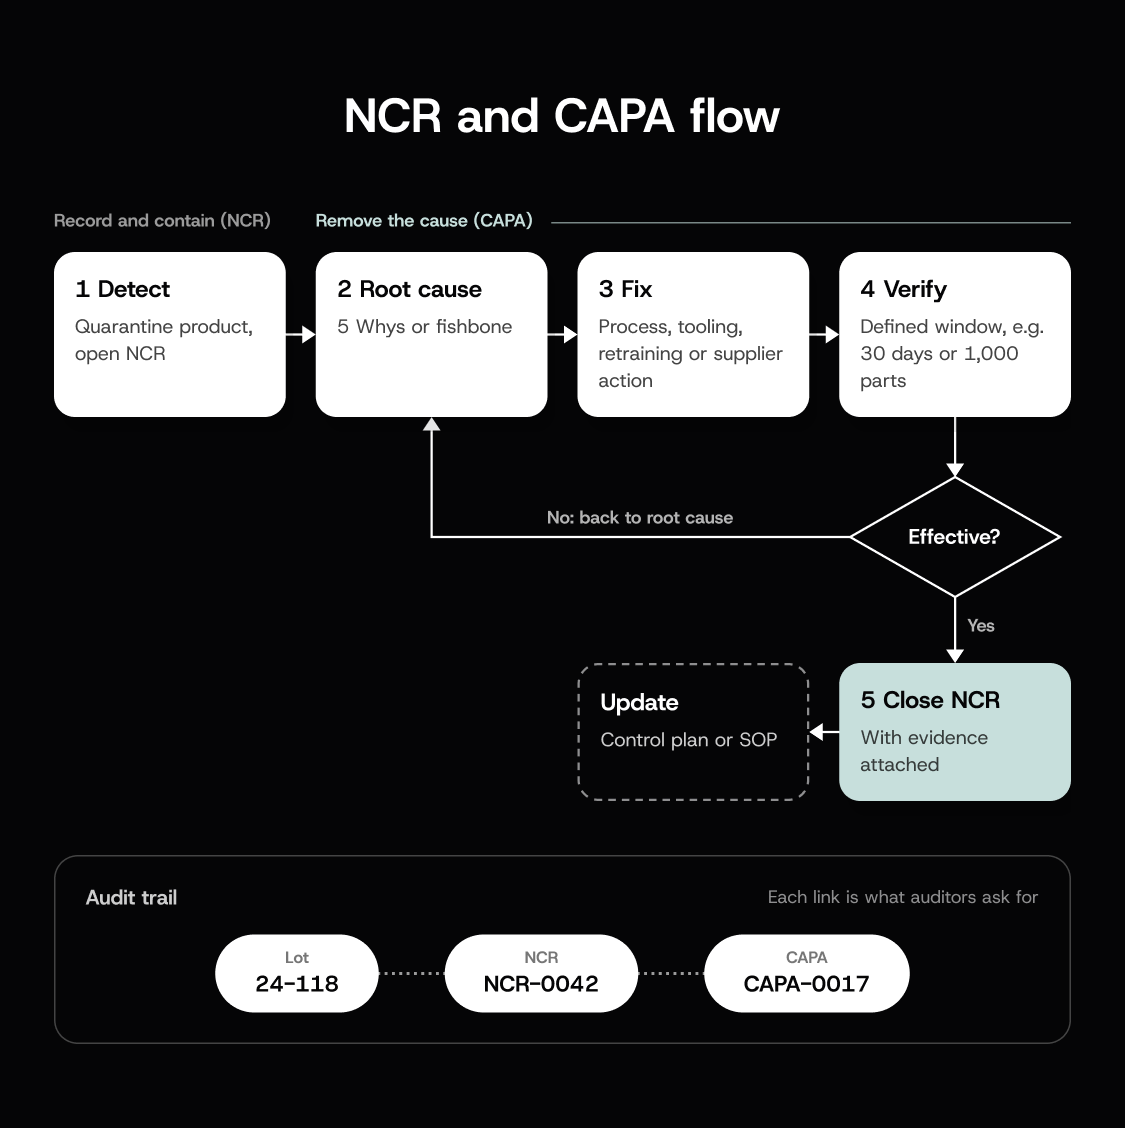
An NCR records any product or process that misses its specification and triggers containment. CAPA is the structured process that removes the root cause and proves the fix works.
- Detect the defect, quarantine affected product, and open an NCR.
- Find the root cause with 5 Whys or a fishbone diagram.
- Implement the fix, such as a process change, tooling adjustment, retraining, or supplier corrective action request.
- Verify effectiveness over a defined window, for example 30 days or 1,000 parts.
- Close the NCR with evidence, then update the control plan or SOP.
When the root cause is human error, prefer error-proofing (poka-yoke) to retraining alone. A fixture that only accepts the part the right way, or automated systems such as in-line sensors that check every part, hold better than a reminder.
Traceability makes this audit-ready: every NCR links to the affected lot, and every CAPA links to its NCR. In an ISO 9001 quality audit, expect auditors to ask for both links.
A simple NCR form records the NCR number, date, product and lot, description, containment, root cause, corrective action, verification method, and closure sign-off.
Download our NCR/CAPA form template to standardize your corrective action process.
Step 6: Measure what matters: KPIs that prove improvement
Steps 1–5 change how work gets done. Key performance indicators (KPIs) show whether it worked. USL and LSL are the upper and lower specification limits.
| KPI | What it measures | Formula |
|---|---|---|
| First pass yield (FPY) | Units passing every check first time | (Units passing first time ÷ total units) × 100 |
| Scrap rate | Units that can't be reworked | (Scrapped units ÷ total units) × 100 |
| Rework rate | Units needing rework | (Reworked units ÷ total units) × 100 |
| Cost of poor quality (COPQ) | Money lost to defects, inside the plant and after shipping | Scrap + rework + warranty and returns costs |
| Customer complaint rate | Escapes that reached the customer, a direct read on customer satisfaction | Complaints ÷ units shipped (often per million) |
| Defects per unit (DPU) | Average defects per unit | Total defects ÷ total units inspected |
| Process capability (Cp) | Whether process spread fits the tolerance | (USL − LSL) ÷ 6σ |
| Process capability index (Cpk) | Fit once centering is considered | Lower of (USL − mean) and (mean − LSL), ÷ 3σ |
Cutting COPQ lowers production costs directly, because every scrapped part carries the raw materials, machine time and labor already spent on it. Inspection and prevention costs belong in the wider cost of quality (COQ), not in COPQ.
There's no universal FPY target. A September 2026 analysis in Reliable found published FPY benchmarks ranging from 85% to 98%, with almost none citing a dataset, so benchmark against your own history. The same goes for COPQ: measure your own. For capability, Cpk ≥ 1.33 is an automotive convention from Automotive Industry Action Group (AIAG) guidance for stable processes, and customer requirements take precedence.
Review SPC charts every shift, FPY and scrap daily, trends weekly, and COPQ monthly. A shared spreadsheet of FPY by line and top NCR causes works as a first dashboard.
Metrics must trigger action: if scrap spikes on one line, review that line's control plan.

Step 7: Digitize quality control, from paper to traceable workflows
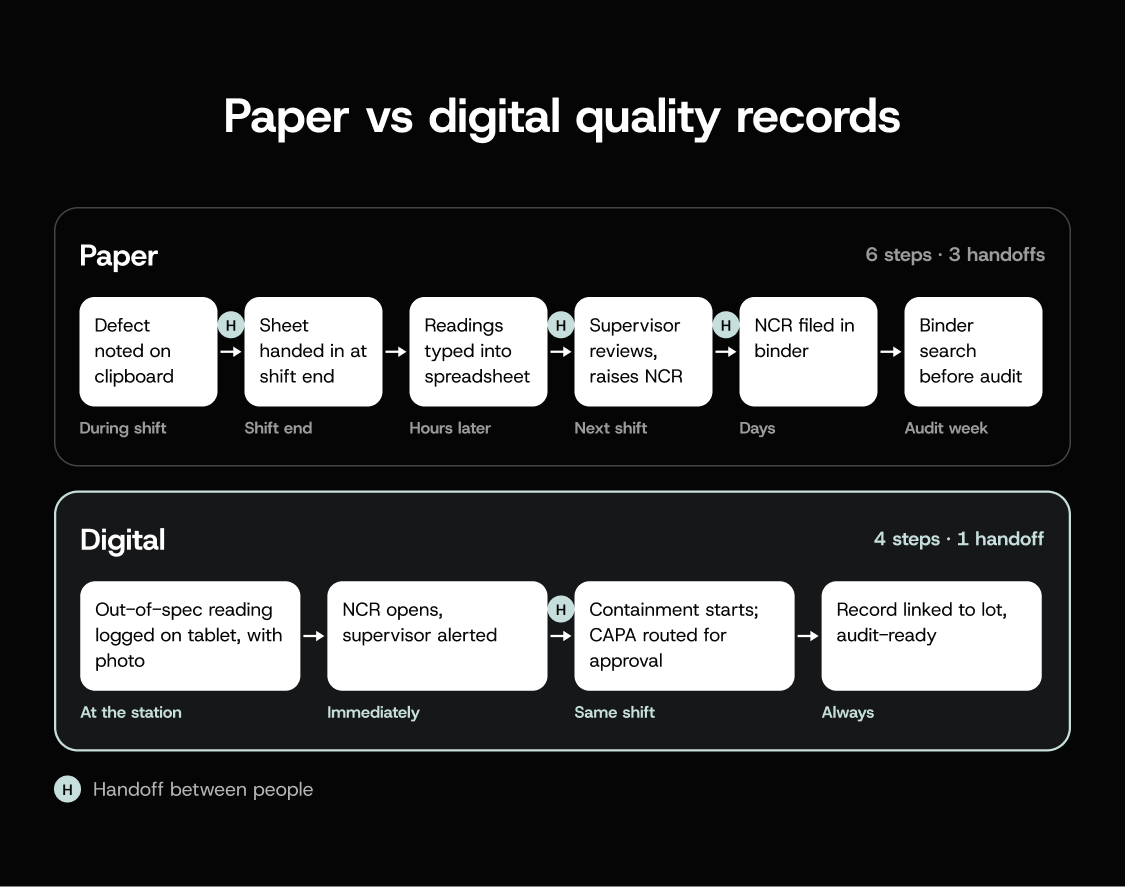
Paper slows every step above. Readings get transcribed hours later, and tracing a lot means cross-checking binders. By then, a drifting process may have made a shift's worth of bad parts.
Digital quality control closes those gaps at the point of work:
- Operators record measurements and photos on a tablet or phone at the station
- Out-of-spec results alert supervisors as they happen
- NCRs and CAPAs route to approvers with timestamped e-signatures, building the audit trail
- Every record links to its lot, so KPIs and audit queries come straight from inspection data
For shop-floor use, test any digital quality control system against four criteria: offline capture, photo and video, voice input, and one-handed use. An operator holding a part won't use a form that needs two hands.
Appfarm is a platform for building custom operational software, and quality apps are a common use for manufacturing and production teams: mobile inspections, NCR workflows, CAPA tracking and quality dashboards. You decide what the app does, meaning which CTQs operators capture, which approvals apply, how NCRs route and what the dashboards show. Appfarm runs everything underneath it: deployment, hosting, security, performance and availability, with an uptime guarantee on every plan (as of October 2026).
You don't have to build it yourself. Most teams start with Appfarm or an implementation partner to scope and build the first version from their control plan and NCR process, then take building in-house later if they want to. Building materials producer Feiring worked with an Appfarm partner and had a usable first version within a month. The full solution, including product sampling, inspection and quality control on running production lines, was implemented in 12 weeks.
A quality app doesn't have to be the only thing you get out of it. Equipment check apps, inventory and traceability systems and compliance audit dashboards can run on the same foundation instead of becoming three more subscriptions. The Essential plan includes five apps (as of October 2026).
Because you build the app instead of adopting a QMS (quality management system) vendor's template, it follows your control plan rather than forcing operators around fixed forms. Describe what you need and Appfarm generates a working app, which you then adjust on the visual canvas or by prompting again: the reaction plan for an out-of-spec bore, who an NCR routes to, what the first-off check asks for. In practice:
- An operator logs an out-of-spec bore on a tablet. The app opens an NCR and alerts the supervisor, so containment starts immediately.
- A CAPA's 30-day effectiveness check runs on live FPY data. The quality manager closes it with evidence attached, ready for the next audit.
The apps work on desktop, tablet and phone, can be installed on a device, and update automatically. Offline support, so inspections keep working on patchy shop-floor Wi-Fi and sync when back online, is available. Through API integrations, inspection results and NCR status can flow into your enterprise resource planning (ERP) system for lot hold and release. See how Appfarm connects to ERP and production systems.
You can export your data at any time. Appfarm hosts on Google Cloud in Belgium and is ISO 27001:2022 certified, which supports governance of your audit records.
Step 8: Rollout and change management: driving adoption on the shop floor

Operators distrust systems that add work without clear benefit, and supervisors resist disruption at peak periods. Plan the rollout carefully.
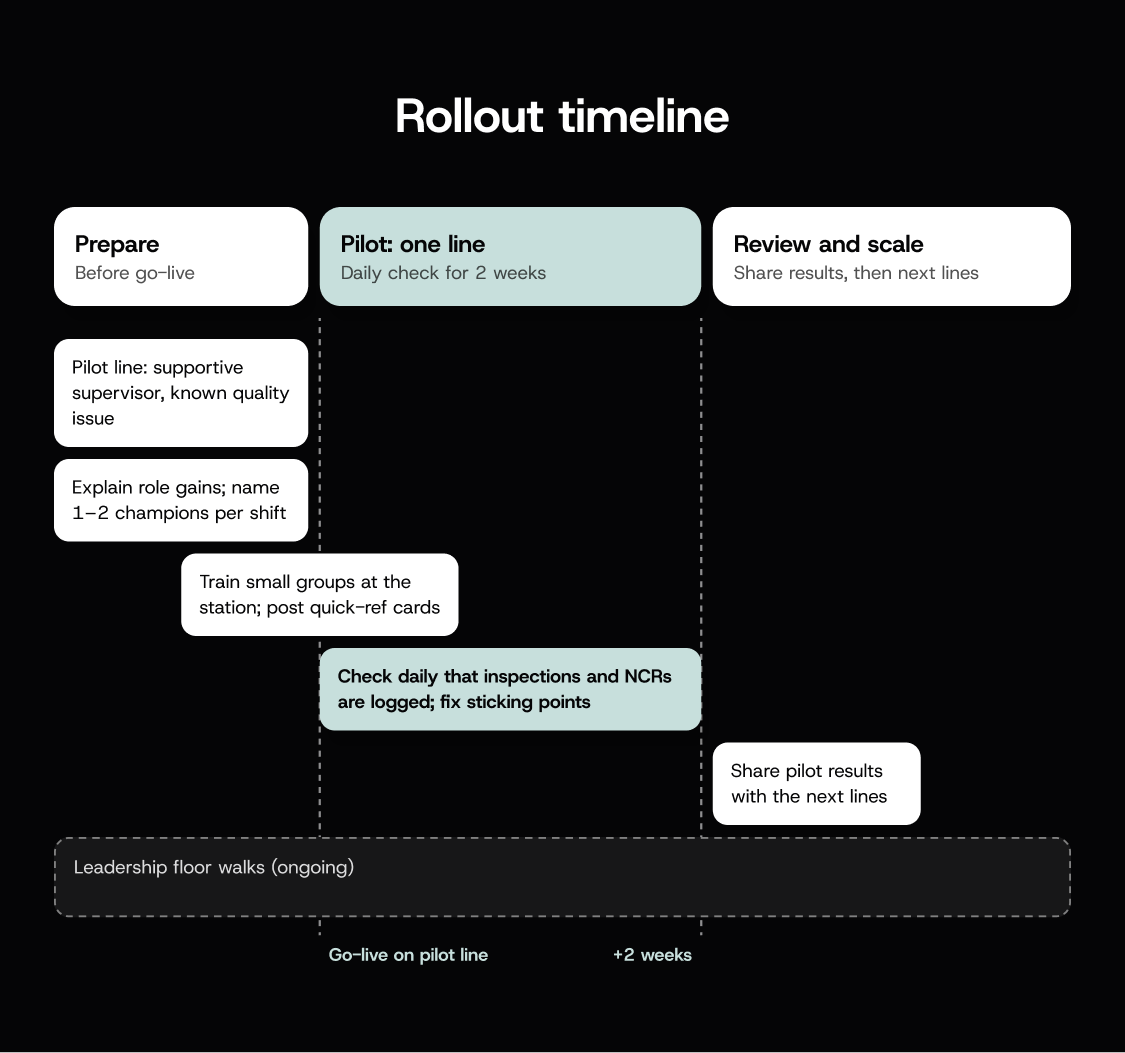
- Pilot on one line with a supportive supervisor and a known quality issue.
- Explain what each role gains, such as clearer instructions for operators and live visibility for supervisors.
- Train in small groups at the workstation, using a real inspection.
- Post quick-reference cards at each station showing the new workflow in four steps.
- Name one or two champions per shift, and recognize them publicly.
- Check daily for two weeks whether inspections and NCRs are logged, and fix sticking points.
- Share pilot results with the next lines before you scale.
For example, a pilot report might read: "Line 3 FPY rose from 92% to 97% in 30 days." That is a hypothetical illustration. Report your own pilot data.
Leadership visibility speeds adoption. When the plant manager walks the floor asking about the new system, operators take it seriously. When leadership is absent, operators treat it as another initiative that will fade.
Conclusion
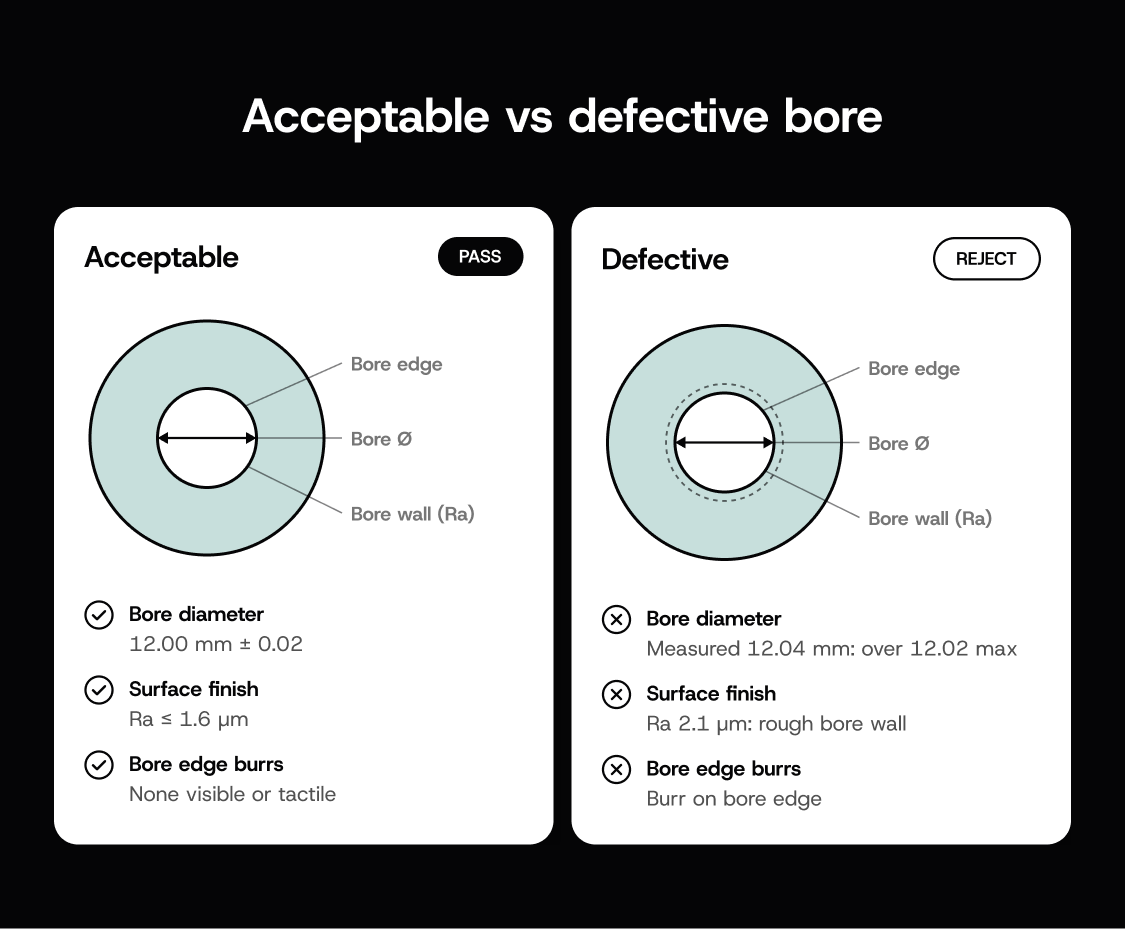
Knowing how to improve quality control in production comes down to eight moves. Define executable standards, build a control plan, and control the process with SPC. Standardize work, close the loop with NCR and CAPA, measure the right KPIs, digitize, and drive adoption deliberately.
The payoff is less scrap and rework, lower production costs, and audit-ready traceability that keeps escapes away from customers.
Tools only help if operators actually use them on the shop floor, mid-shift. Look for offline capture, photo and video, voice input, and one-handed use, then pilot with real crews before scaling.
See how manufacturers run quality, maintenance and supplier apps on Appfarm
FAQs about improving production quality control
What are the 5 P's in quality improvement?
The 5 P's are a common teaching model with varying definitions, and no formal standard defines them. One version covers People (trained staff), Process (standardized methods), Product (clear specifications and CTQs), Plant (equipment and environment), and Planning (control plans and metrics). Use it as a diagnostic checklist.
What are the 7 QC rules?
There isn't one standard list. People usually mean one of two things. The first is the seven basic quality tools: cause-and-effect diagram, check sheet, control chart, histogram, Pareto chart, scatter diagram, and a flowchart or stratification. The second is control-chart run rules, which NIST lists as one point beyond 3σ, two of three beyond 2σ, four of five beyond 1σ, eight in a row on one side, six in a row trending, and 14 alternating.
What are the three C's of quality control?
Like the 5 P's, the three C's are a teaching model with varying definitions. A common version starts with Consistency (the same result every time) and Conformance (output meets specifications). The third is Continuous improvement, where the system learns from feedback and corrective actions.
What are the 7 steps of quality control?
There's no single official list, but one practical seven-step process starts by (1) defining standards and CTQs, (2) building a control plan, and (3) inspecting. It continues with (4) analyzing data, (5) raising NCRs, (6) implementing CAPAs, and (7) verifying effectiveness. The cycle then repeats as processes change.
How often should in-process inspections be performed?
It depends on process capability and risk. Stable, capable processes can often use sampling, such as the first piece plus a set number per hour. New or unstable processes need tighter sampling or 100% inspection until proven, and safety-critical CTQs may always need 100%.
What is the difference between quality control and quality assurance?
ASQ defines quality control (QC) as the part of quality management focused on fulfilling quality requirements, mostly inspection. Quality assurance (QA) focuses on providing confidence those requirements will be fulfilled. ASQ treats QC as a subset of QA and notes the terms are often used interchangeably. Both sit inside wider quality management approaches, such as an ISO 9001 quality management system or total quality management (TQM).
What are the main quality control methods?
The main quality control methods in production are inspection (100% or sampled, such as AQL sampling per ISO 2859-1), first-off and first-article inspection, SPC, error-proofing, and root cause analysis through NCR and CAPA. Most plants combine them in one control plan, matching each CTQ to the method that fits its risk and volume.
How do you calculate first pass yield (FPY)?
Divide the units that pass every inspection on the first attempt, with no rework, by total units produced, then multiply by 100. If 950 of 1,000 units pass first time, FPY is 95%. Track it daily by line, and benchmark against your own history.
When should you digitize quality control processes?
Digitize when paper creates lag, such as inspection data recorded hours later, or traceability gaps that force binder searches before audits. Start with high-volume workflows like in-process inspections and NCR tracking. Pilot on one line, confirm operators use it, then scale.
More reading

There are no items matching your filters. Please try another filter to view results.
We have a lot of helpful resources. Try another filter or reset the filters to find the resource for you.
Digital transformation without disruption